Make Beautiful Tables using R
Fully customize your tables with colors, images and graphics with gt.
Would you like to learn how to create more engaging and better looking tables using the R programming language?
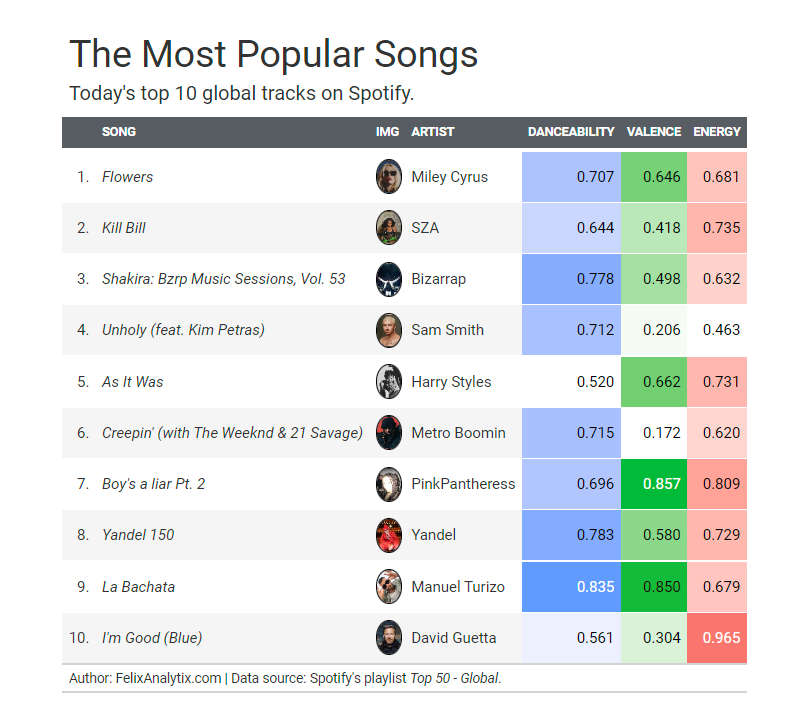
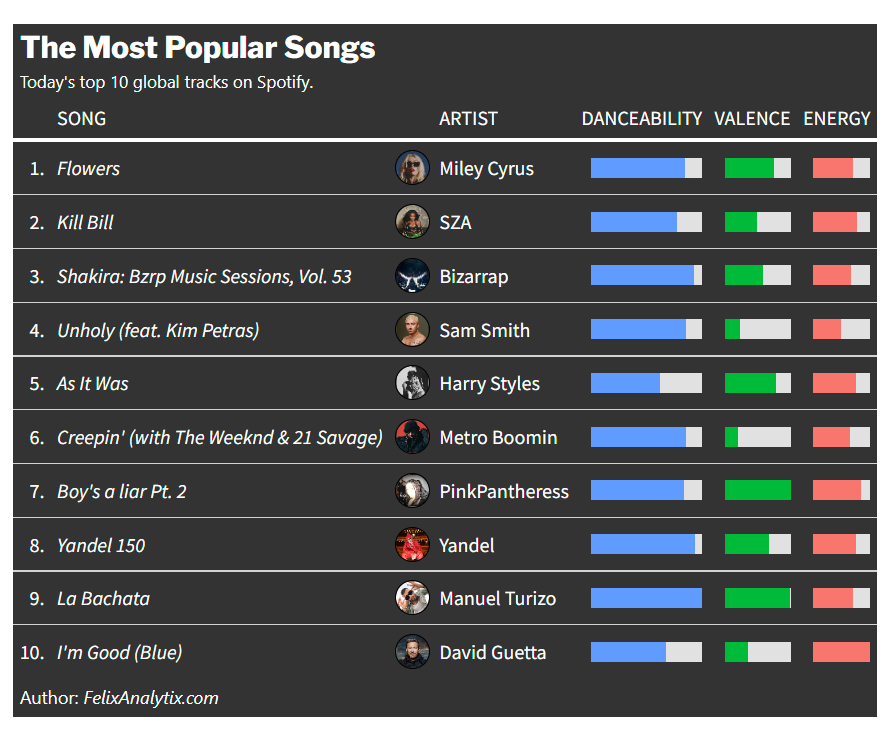
I just release a new YouTube video showing you how to access Spotify data to get the top 10 most listen songs and visualize them on a table.
You will learn how to:
- fully customize any element of a table and use pre-built themes.
- add any images programmatically from the Web.
- insert graphics such as bar plots, sparklines, etc.
- merge columns to better synthesis information.
Visualisations